Parks provide opportunities for physical activity, social engagement, and stress relief, and serve as key components of healthy communities and an effective strategy for chronic disease prevention, on both the individual and population level. However, not all parks are created equal. The availability of facilities, park quality, and surrounding neighborhood conditions may vary greatly among parks within and across neighborhoods. Higher racial/ethnic minority and lower SES communities typically have access to fewer parks, and the parks they do have are often smaller and more outdated. Newer parks and playgrounds are often associated with higher physical activity levels and usage and greater perceptions of safety and social cohesion. To maximize the potential of parks for disease prevention and health promotion, an accurate understanding of the park resources must be obtained.
The overall purpose of this project was to understand the distribution of health-promoting resources in a large Southeastern city. The Neighborhood Park Equity Project included two phases:
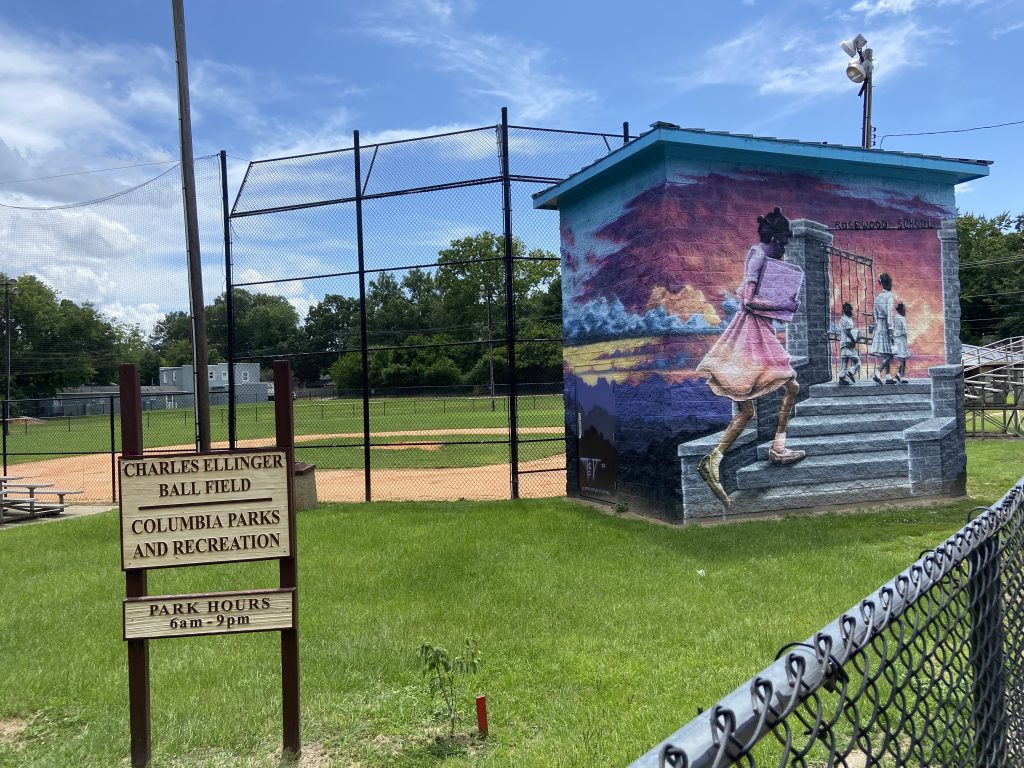
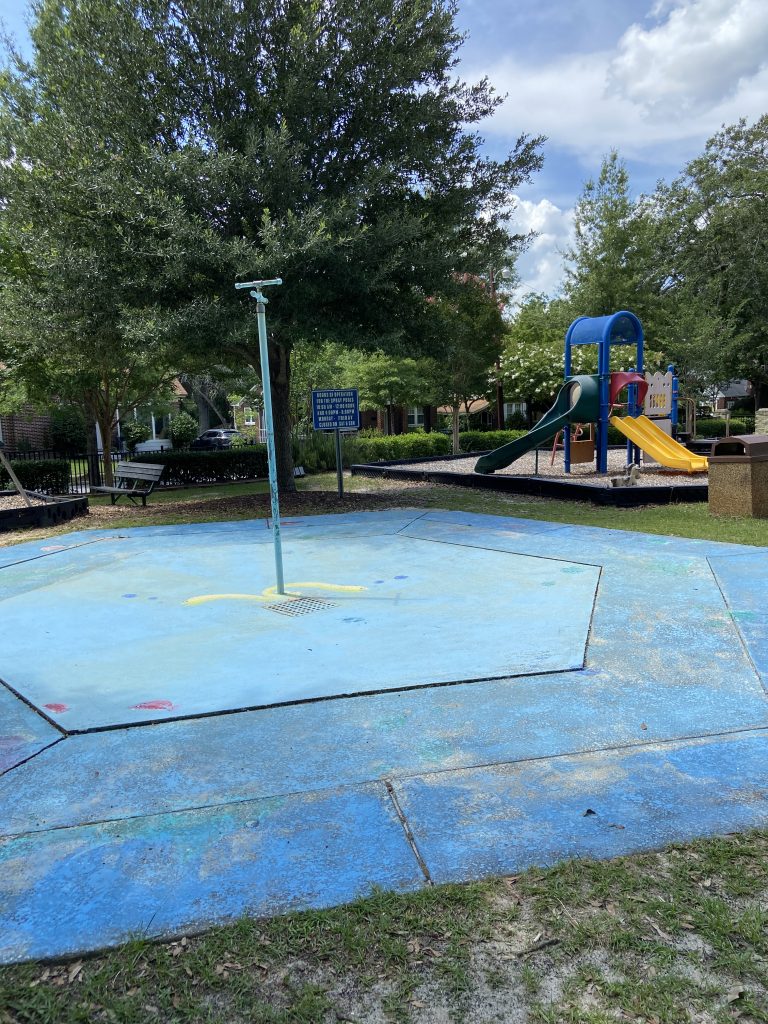
Phase 1: Collect park access and quality data on all 78 parks in the Greater Columbia Area
This study took place in the metropolitan area within the I-77/I-26 loop of Columbia, SC. This loop surrounds the cities of Columbia (the state capital of SC), West Columbia, Cayce, and Forest Acres. Whilst these cities have separate city governments, the cities flow into each other and residents move freely between the cities daily. This region spreads across 253 census block groups and contains a 2019 estimated population of 315,639, land area of 276.89 square miles, and 78 diverse parks (including neighborhood, regional, and specialty parks). The region has a diverse population, with 31.7% of residents identifying as Black or African American and 57.3% as White, and citizens of all ages, including 24.8% age 19 and under as well as 12.0% over age 65. The block group median household income in this region ranges from $11,550 to $214,643, with more residents below the poverty line (19.75%) compared to the state estimate (13.8%).
All demographic data, including racial/ethnic composition, percent of the population that is unemployed, percent with less than a high school education, percent of renter occupied housing, and percent under 125% of the federal poverty threshold was publicly available at the block-group level and was collected using NHGIS. Community Park Audit Tool (CPAT) data were collected in-person for all parks using a Qualtrics-based online CPAT tool on mobile devices.
Phase 2: Examine inequities in park access according to neighborhood socioeconomic status and race/ethnicity.
As an evaluation tool, CPAT allows stakeholders to audit parks for their potential in promoting physical activity by determining an overall park score. Neighborhood ParkIndex Scores are used to indicate the probability of health-promoting park use for a given area. The ParkIndex includes the number of parks, total amount of park space, and average park quality score for parks within ½ mile of the area or address. The average park quality score is a value composed of CPAT data. A mean ParkIndex value for each block group in the study area will be calculated.
This ParkIndex score will then be compared to neighborhood level of socioeconomic disadvantage and racial/ethnic composition in order to assess level of equity in the distribution and quality of greenspace.
Funding
Advanced Support for Innovative Research Program at the University of South Carolina